
 By Adrian Pascual•Hiring insight•Published
How to Benchmark Screening Performance for HR Teams
To benchmark screening performance for HR teams, measure five categories simultaneously: funnel efficiency, speed, quality-of-hire proxies, candidate experience, and HR team productivity. Three starter KPIs give you the fastest signal: time-to-screen (hours from application to screener decision), screened-to-interview rate (screened candidates who advance, expressed as a percentage), and first-90-day retention proxy (new hires still active at day 90 as a share of total hires from that cohort). According to SmartRecruiters' aggregated benchmark data, the global median time-to-hire sits near 38 days, giving you a concrete external anchor for your own speed targets. SHRM's 2026 recruiting brief adds that extra-large organizations saw a significant increase in requisitions per recruiter, which signals how much pressure HR teams are absorbing without proportional measurement infrastructure.
Your first action: pull 30 days of raw data from your ATS and screening platform, calculate those three KPIs by role family, and compare them against SHRM or SmartRecruiters peer percentiles. That single exercise will surface your biggest gap before you build anything more elaborate.
Pro Tip: Set a calendar reminder now for a 30-day data pull. The teams that delay baseline measurement until their process is "ready" rarely start at all. Imperfect data collected consistently beats perfect data collected never.
Key Takeaways
Effective screening benchmarking requires cohorting before comparing, a metric charter before a dashboard, and an audit layer before trusting automated filters.
| Point | Details |
|---|---|
| Pull a 30-day baseline first | Extract ATS and screening data by role family before setting any targets. |
| Use a metric charter | Document owner, definition, data source, frequency, and action threshold for every KPI. |
| Require 30+ observations per cohort | Subgroup pass rates and conversion metrics are unreliable below that sample floor. |
| Audit automated filters quarterly | Checkr data shows 58% of HR leaders encountered hiring fraud; unmeasured filters compound that risk. |
| Evy provides audit-ready screening data | Structured scoring logs, eye-tracking signals, and ATS integration feed directly into a benchmarking dashboard. |
Table of Contents
- What should you measure to benchmark screening and HR team performance?
- How do you set objectives and choose the right KPIs for your team?
- How do you design reliable data collection and assessment workflows?
- How do you analyze data and build defensible benchmarks?
- How do you turn benchmark results into a prioritized improvement plan?
- What screening-specific risks should you measure and audit?
- A practical benchmarking framework and dashboard you can deploy
- Evy gives HR teams a measurable screening baseline from day one
- Sources
What should you measure to benchmark screening and HR team performance?
Screening metrics fall into seven distinct categories, and conflating them is the most common reason benchmarking programs produce noise instead of insight. Each category answers a different management question.
Screening funnel (volume and conversion) tracks how candidates move through each stage. Key KPIs include application-to-screen rate (applications reviewed as a share of total received) and screen-to-interview rate. These tell you whether your filters are calibrated or over-aggressive.
Speed metrics cover time-to-review (hours from application receipt to first screener action), time-to-interview (days from screen pass to first interview scheduled), and time-to-offer. Speed metrics are lagging indicators of process friction, not recruiter effort.
Cost metrics include cost-per-screen (total screening spend divided by screened candidates) and cost-per-hire (total recruiting spend divided by hires). These are most useful when trended over quarters rather than read as point-in-time figures.
Quality-of-hire proxies are where screening benchmarking gets genuinely predictive. Interview-to-offer ratio, offer acceptance rate, and first-90-day retention are the three most practical proxies available without a formal performance-rating system. Meta-analytic research by Schmidt and Hunter confirms that combinations of predictors, such as general mental ability paired with a structured interview or work sample, deliver higher validity for predicting job performance than any single measure alone. That finding has direct implications for which screening signals you choose to benchmark.
Candidate experience is measured through post-screen NPS surveys and drop-off timing (the stage at which candidates abandon the process). Drop-off timing is particularly diagnostic: abandonment at the screening stage often indicates friction in the process itself, not candidate disinterest.
Bias and diversity signals require selection ratio analysis by demographic subgroup and subgroup pass rates at each funnel stage. These are compliance-adjacent metrics, not optional additions.
HR team productivity rounds out the picture with requisitions-per-recruiter and hires-per-recruiter, both of which SHRM tracks at the organizational level.
| KPI | Formula | Cadence |
|---|---|---|
| Time-to-screen | Avg. hours from application to screen decision | Weekly |
| Screen-to-interview rate | (Candidates advanced / Candidates screened) | Monthly |
| Cost-per-screen | Total screening spend / Candidates screened | Quarterly |
| First-90-day retention | (Hires active at day 90 / Total hires in cohort) | Quarterly |
| Subgroup pass rate | Pass rate for subgroup A / Pass rate for subgroup B | Quarterly |
| Requisitions per recruiter | Open requisitions / Active recruiters | Monthly |
The distinction between screening-specific KPIs and end-to-end recruiting KPIs matters because they have different owners, different data sources, and different intervention points. Time-to-screen is owned by the screening workflow; time-to-hire is owned by the full recruiting function. Mixing them in a single dashboard without labeling the ownership creates accountability gaps.
How do you set objectives and choose the right KPIs for your team?
Start with the business objective, not the metric. Four objectives drive most screening benchmarking programs: speed, quality, compliance, and candidate experience. Map one or two KPIs to each, and you have a balanced scorecard that prevents over-optimizing one dimension at the expense of another.
A metric charter makes each KPI operational. For every metric you commit to tracking, document six fields:
- Owner: the specific role responsible for pulling and reporting the metric
- Definition: the exact numerator and denominator, with no ambiguity
- Data source: the system of record (ATS, HRIS, screening platform)
- Frequency: how often the metric is calculated and reviewed
- Sample-size rule: the minimum number of observations before the metric is reported (more on this below)
- Action threshold: the value that triggers a formal review or process change
Without an action threshold, metrics become decoration. Set one before you publish the dashboard.
KPI targets by organizational maturity
Organizations at different stages need different target bands. A pilot program running its first 30-day baseline should not hold itself to the same standard as a team with two years of cohorted data.
- Pilot stage: focus on establishing a baseline, not hitting a target. Your goal is data hygiene and consistent collection.
- Established stage: compare your median against external percentiles (SHRM, SmartRecruiters) and set a 90-day improvement target of 10–15% on your weakest metric.
- Advanced stage: set stretch targets at the 75th percentile of your peer group and run controlled experiments to test process changes.
Leading vs. lagging indicators deserve deliberate selection. Time-to-screen is a leading indicator of downstream speed; first-90-day retention is a lagging indicator of screening quality. You need both. When lagging indicators are unavailable (a new program, a small team), proxies work: structured interview scorecard completion rate is a reasonable proxy for screening rigor before you have retention data.
How do you design reliable data collection and assessment workflows?
Reliable benchmarking depends on consistent data extraction before any analysis begins. The typical data sources for a screening benchmarking program are:
- ATS: application timestamps, stage transitions, disposition codes, recruiter assignments
- Screening platform logs: screen start/end times, scores, completion rates, flagged anomalies
- Background-check provider: turnaround times, exception rates, compliance flags
- HRIS: hire dates, 90-day active status, performance ratings (where available)
- Onboarding system: completion rates and time-to-productivity markers
Assign a named owner to each data pull, specify the exact fields to extract, and store outputs in a single shared location with version control. Ownership gaps are where benchmarking programs quietly fail.
Normalization rules prevent you from comparing apples to oranges. Cohort your data by role family (engineering vs. operations vs. sales), hiring level (individual contributor vs. manager), geography (where labor markets differ materially), and hiring channel (inbound vs. sourced vs. referral). Internal mobility candidates should be tracked separately; their funnel behavior is structurally different from external applicants.
When a candidate submits multiple applications in the same period, count only the most recent active application per role to avoid inflating volume metrics. Reopened requisitions should be flagged and excluded from time-to-fill calculations unless you are specifically studying reopen patterns.
On privacy and compliance: candidate screening data requires documented consent for storage and use in analytics, and background-check records carry specific retention limits under the Fair Credit Reporting Act. Build those constraints into your data governance policy before you start pulling records.
Pro Tip: *Before your first data pull, audit your ATS disposition codes.
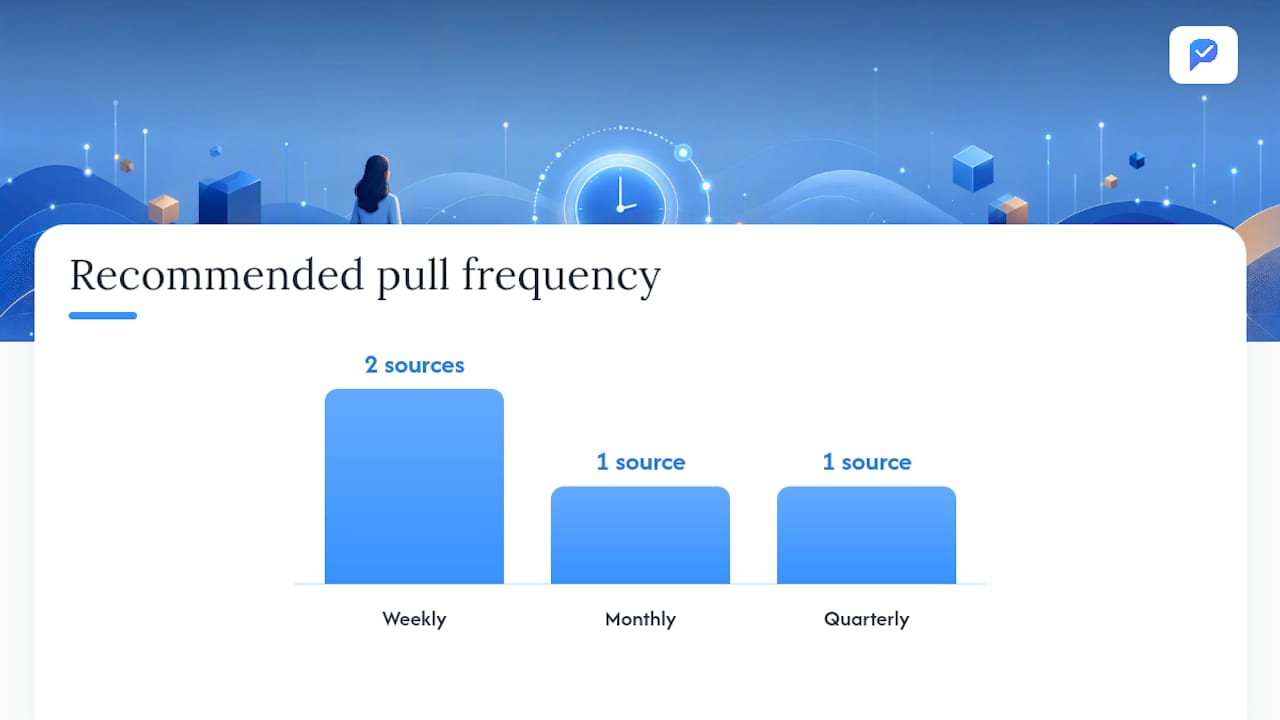
| Data source | Key fields to extract | Recommended pull frequency |
|---|---|---|
| ATS | Application date, stage dates, disposition code, recruiter ID, role family | Weekly |
| Screening platform | Screen start/end, score, completion flag, anomaly flag | Weekly |
| Background-check provider | Order date, completion date, exception type | Monthly |
| HRIS | Hire date, 90-day active status, department, level | Quarterly |
A 90-day baseline program typically requires one part-time analyst (roughly 8–12 hours per week), access to ATS and HRIS APIs or export functions, and a BI tool or structured spreadsheet. Technology costs vary by vendor, but most ATS platforms include basic export functionality at no additional charge.
How do you analyze data and build defensible benchmarks?
Raw data becomes a benchmark through four analytical steps: cohorting, normalization, percentile placement, and statistical validation.
Cohorting is the most important step. A time-to-screen figure that mixes software engineers, warehouse associates, and executive roles is meaningless as a management signal. Separate cohorts by role family and level first, then by geography if your hiring spans materially different labor markets.
Normalization removes distortions that would make your numbers incomparable over time. Remove outliers (applications that sat unreviewed for more than 30 days due to system errors or recruiter leave), flag and exclude reopened requisitions, and adjust for seasonal hiring surges by indexing to a rolling 12-month average rather than a single quarter.
Percentile-based targets give you a defensible standard. Here is a worked example:
- Pull 90 days of time-to-screen data for your software engineering cohort.
- Calculate the median and the 75th percentile for your internal data.
- Compare your median against the SmartRecruiters global median of 38 days for time-to-hire as a directional anchor (adjust for the fact that time-to-screen is a sub-component of time-to-hire).
- Set your baseline target at your current median and your stretch target at the 75th percentile of your peer group.
- Review quarterly and update the target band when you have at least one full additional quarter of data.
Statistical reliability requires minimum sample sizes before you publish a benchmark. For conversion rate metrics (screen-to-interview rate), you need at least 30 observations per cohort to produce a stable percentage. For subgroup pass-rate comparisons, the standard four-fifths rule used in adverse impact analysis requires enough volume in each subgroup to detect meaningful differences. If a cohort has fewer than 30 screened candidates in a quarter, report it as directional only and flag it explicitly in your dashboard.
APQC's benchmarking methodology distinguishes four benchmarking types: internal (comparing teams within your organization), competitive (comparing against direct industry peers), functional (comparing against organizations with similar processes regardless of industry), and generic (comparing against best-in-class regardless of sector). For most HR teams starting out, internal benchmarking is the fastest path to defensible targets because the data is already in your systems.
How do you turn benchmark results into a prioritized improvement plan?
A benchmark result is only useful if it triggers a decision. Use a two-axis prioritization matrix to rank your gaps: place each underperforming metric on a grid with impact on hiring outcomes on the vertical axis and effort to improve on the horizontal. Focus your first pilot on high-impact, lower-effort items.
For each initiative you select, document a simple experiment structure:
- Hypothesis: "If we add a structured scorecard to the phone screen, screened-to-interview rate will improve by 10% within 60 days."
- Metric: screened-to-interview rate for the target role cohort
- Duration: 60 days
- Sample: minimum 30 screened candidates in the test cohort
- Decision rule: if the rate improves by 8% or more, expand; if it improves by less than 4%, pause and diagnose
Governance keeps the program honest. Assign a named owner for each benchmark, schedule a quarterly review with your recruiting leadership team, and publish a one-page scorecard to stakeholders that shows current performance against target, trend direction, and the one action in progress. Scorecards with SLAs attached (for example, "time-to-screen will not exceed 48 hours for priority roles") create accountability without micromanagement.
Common remediation patterns worth running as pilots:
- Screening bottleneck: if time-to-screen exceeds your target, audit the handoff between application receipt and first screener action. Often the delay is a notification or routing issue, not recruiter capacity.
- Automated filter audit: if your screen-to-interview rate is unusually low, review your ATS knockout filters for over-restriction. Excessive top-funnel filtering can harm candidate experience and trust without improving quality.
- Structured scorecard rollout: if interview-to-offer ratio is volatile, inconsistent screening criteria are usually the cause. Standardizing the scorecard reduces variance within two to three hiring cycles.
Pro Tip: Run your first experiment on a single role family with high hiring volume. A focused pilot with 30–50 screened candidates gives you a readable signal in 60 days. Broad rollouts across all roles simultaneously make it impossible to isolate what changed.
What screening-specific risks should you measure and audit?
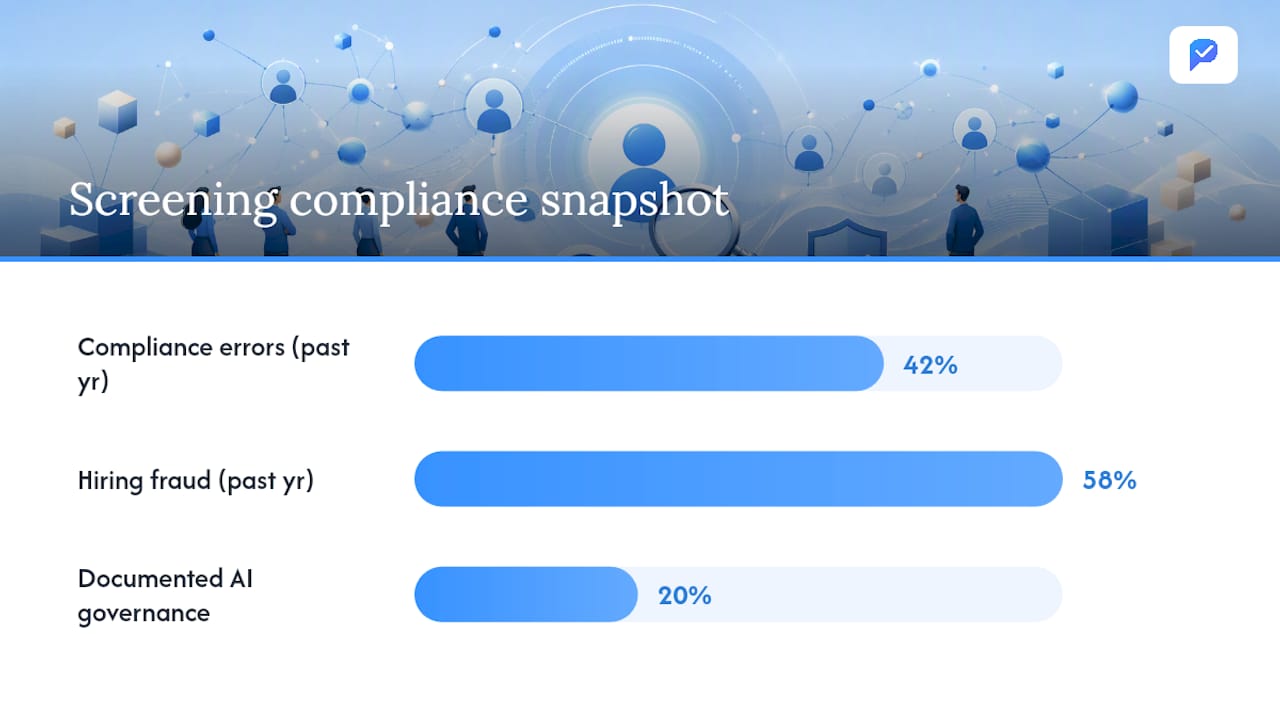
Screening benchmarks without an audit layer are incomplete. The compliance and fraud picture is more serious than most benchmarking guides acknowledge. Checkr's survey of 2,500 HR leaders found that 42% experienced at least one screening compliance error in the past year, 58% encountered hiring fraud, and only 20% had documented, enforced AI governance policies. Those figures suggest that most organizations are benchmarking speed and conversion while leaving compliance and fraud exposure unmeasured.
An audit metric checklist for screening tools should include:
- False positive rate: screened-out candidates who would have succeeded (estimated via post-hire performance data for a sample of borderline rejections)
- False negative rate: candidates advanced who underperformed, tracked against first-90-day retention
- Subgroup pass rates: pass rates by demographic subgroup at each funnel stage, reviewed quarterly against the four-fifths adverse impact threshold
- Review-error rate: percentage of screening decisions that required correction or appeal
- Time-to-detection of fraud: hours from a fraudulent submission to flagging, for platforms with detection capability
AI governance is a specific gap. When automated screening tools make or heavily influence pass/fail decisions, you need documented policies covering how the model was validated, how often it is audited, and who has override authority. The Checkr compliance data shows that consolidating compliance ownership into general HR teams without process-level controls increases execution risk.
On validity and applicant reactions: a Personnel Psychology review highlights that transparency about selection procedures affects applicant reactions and that practice effects (candidates improving scores through repeated exposure) can distort screening benchmarks over time. If your screening tool is widely known and candidates can practice it, your pass-rate data may drift upward for reasons unrelated to actual candidate quality. Track score distributions over time, not just pass rates.
For subgroup pass-rate comparisons to be statistically meaningful, you need at least 30 candidates per subgroup per quarter. Below that threshold, report the metric as directional and flag it clearly.
AI screening mechanics introduce additional measurement considerations: automated scoring can compress variance in ways that make cohort differences harder to detect, and eye-tracking or attention signals require their own validation against downstream performance data before being used as hard filters.
Pro Tip: Schedule a quarterly "audit hour" where one person reviews 10–15 borderline screening decisions from the prior period. That manual review is the fastest way to detect systematic bias or filter miscalibration before it shows up in your subgroup pass-rate data.
A practical benchmarking framework and dashboard you can deploy
The core benchmarking cycle has six steps: measure, cohort, normalize, benchmark, act, re-measure. Run that cycle quarterly for established metrics and monthly for speed metrics during an active improvement initiative.
A functional dashboard needs the following tiles and fields:
- KPI tile: metric name, current value, target value, trend direction (up/down/flat over the prior period)
- Cohort filter: role family, level, geography, hiring channel
- Sample size: number of observations in the current period (flag if below minimum)
- Percentile band: where your current value sits relative to your peer group (internal quartile or external percentile)
- Trend sparkline: 6-period rolling view to distinguish noise from signal
Color thresholds keep dashboards readable without requiring narrative explanation. Avoid more granular color scales; they create false precision.
For teams building in a BI tool or spreadsheet, the minimum CSV export fields are:
| Field | Description |
|---|---|
| cohort_id | Role family + level + geography code |
| period | Quarter or month (YYYY-MM format) |
| kpi_name | Standardized metric name from your charter |
| numerator | Raw count for the numerator |
| denominator | Raw count for the denominator |
| kpi_value | Calculated metric value |
| sample_size | Total observations in the cohort-period |
| target_value | Charter-defined target for this cohort |
| percentile_band | Internal quartile or external percentile label |
| flag | Data quality or sample-size flag |
University of Iowa's HR Benchmarking Toolbox provides a practical reference for cohort selection methods and peer-comparison data sources, particularly useful for public-sector or academic HR teams building their first benchmarking infrastructure.
The Hackett Group's AI World Class HR benchmarks model suggests that process-led AI transformation (redesigning workflows for AI rather than automating existing suboptimal processes) can reduce recruiting costs-per-hire and improve recruiter productivity substantially. Those are modeling-based ranges, not guaranteed outcomes, but they establish a directional case for investing in process redesign alongside measurement.
For teams tracking technical role screening specifically, add a scored-response consistency field to your export: the variance in structured scores across interviewers for the same candidate is a direct measure of scoring reliability.
A note on what actually matters in practice
The most common mistake in screening benchmarking is measuring everything before cohorting anything. Teams pull a global time-to-hire figure, compare it to a published median, declare themselves above or below average, and stop there. That exercise produces a number, not an insight.
The fix is smaller than most people expect. Start with one role family, one quarter of data, and two KPIs. Prove that your measurement is consistent and that your cohort is clean. Then expand. Every benchmarking program I have seen succeed followed that sequence. Every one that failed tried to build a 20-metric dashboard in month one.
Evy is worth considering as part of this infrastructure because it surfaces screening audit metrics that most ATS platforms do not: structured scoring logs, candidate-experience signals, and attention pattern data that can serve as an early indicator of response authenticity. Those signals feed directly into the audit layer described above, without requiring a separate manual review process.
The single most useful pilot design for a new benchmarking program: pick your highest-volume role, run a 60-day structured screening cohort with consistent scoring criteria, and compare screen-to-interview rate and first-90-day retention against your prior unstructured baseline. That comparison, with as few as 30 candidates in each cohort, will tell you whether your screening process is adding predictive value or just adding time.
Evy gives HR teams a measurable screening baseline from day one
Most benchmarking programs stall because the data infrastructure isn't there. Evy solves that specific problem. Every interview run through Evy generates structured scoring logs, candidate-experience signals, and real-time attention pattern data, including eye-tracking indicators that flag potential AI-assisted responses. Those outputs map directly to the audit metrics described in this article: false positive rates, subgroup pass rates, score consistency, and time-to-detection of fraud.
A typical Evy pilot runs 30–90 days, covers one or two role families, and produces enough data to calculate screen-to-interview rate, scoring consistency, and candidate-experience NPS within the first month. The organizations that benefit most are teams hiring at scale for technical or knowledge-work roles where response authenticity and structured scoring matter. If your team is hiring fewer than 10 candidates per quarter in a single role family, a full pilot may produce too small a sample to be statistically meaningful. For high-volume teams and those needing a defensible audit trail, the fit is direct.
Evy's AI interview platform integrates with major ATS platforms, so your screening data flows into the same export pipeline described in the dashboard section above. Start a pilot and collect your first cohort of benchmark-ready screening data.
Sources
- Recruiting Benchmarks 2025-2026 Report FINAL
- 2026 Recruiting Executives Benchmarking: Attracting Critical Talent
- The Validity and Utility of Selection Methods in Personnel Psychology
- Personnel Psychology review on selection methods (DOI)